
Data and indicators for a circular built environment – why they matter
Cities need to take action in many areas to enable a transition to circularity within the built environment. This includes introducing new policies, supporting the development of novel business cases, and advancing material exchange infrastructure. However, if these actions are to be successful, they must be underpinned with robust, quality and accessible data.
Successfully building using circular eocnomy principles requires access to additional information about the local building stock and building industry that is not required in BAU take-make-use-dispose models. The specific characteristics of a building or material need to be defined, recorded, and shared freely, and at the right time during the construction process. This need for additional data was clearly highlighted by key findings from the CIRCuIT project:
Limited data leads to limited results – It is not possible for decision makers at any level to identify key challenges and opportunities relating to the circular economy without robust, quality data.
Accurate, reliable and complete data is needed – Modifying the circularity of a city requires the availability of as much detailed data on as many relevant systems as possible.
Data enables circularity of material flows – The flow of resources is influenced by decision makers who could use data to create circular material flows.
Standardisation is key to the exchange of data – The standardisation of units and formats of datasets is key to facilitating and promoting the exchange of quality data amongst different built environment stakeholders.
To successfully analyse large amounts of data at the city-level, cities need high-quality circular indicators. A circularity indicator is a piece of information that can be used to measure performance within the built environment to guide decision making and enable stakeholders to communicate their circular economy actions in a consistent way. Indicators can help cities benchmark their current activities, set clear goals, communicate about benefits, and assess their performance against targets.
Measuring circularity in the built environment is still a relatively unexplored area. Even though there is often a large volume of data captured, the CIRCuIT project found there are still many gaps in data and other data challenges for circularity to be successfully adopted in cities. These challenges include limited accessibility to existing data, as well as the data often having poor accuracy, granularity and interoperability.
In addition, cities do not fully understand what data they need to measure to get a better picture of circularity in their city. The infrastructure to capture, analyse and store the data that’s needed is also not always set up to a necessary standard.
This chapter showcases the tools, methodologies and recommendations developed by CIRCuIT to standardise and improve the capture of circular data relating to the built environment. This includes templates that standardise data capture, as well as 37 key indicators that built environment stakeholders can use to guide decision making and measure circularity performance so they can drive forward circularity in their city.
 Data to measure circularity – the current state of play
To explore what data cities typically have access to, as well as identify what data is needed to measure circularity within the built environment, the four cities involved in the CIRCuIT project carried out two key activities:
Activity 1 – Mapping data in a city – This was a data mapping exercise that aimed to identify the data accessible to each CIRCuIT city in relation to historical, current and future building material stocks and flows.
Activity 2 – Assessing the usefulness of available data – This exercise assessed whether the data identified as ‘accessible’ during activity 1 can deliver the insights needed to help cities transition to circularity in the built environment.
Undergoing these activities are key steps in the transition towards a circular built environment, as they can highlight data gaps and other challenges relating to data.
When the four cities involved in the CIRCuIT project carried out these two activities, they identified the following key findings:
Accessibility of data – Large volumes of data were often present but held privately and not open for access. This significantly hindered material flow related work that requires an overview of all construction in the city.
Spatial and temporal granularity – Datasets did not align in terms of the geographical area they covered or the frequency of their updates. This meant the conclusions that could be drawn were very general or out of date.
Inaccuracy and unreliability – Datasets were not always accurate, due to human error, double counting, extrapolations, etc.
Standardisation and interoperability – Datasets were not standardised, which meant they could not be aggregated and used together.
The steps the CIRCuIT cities followed to undertake these activities are outlined in this chapter, as are key learnings that can help to inform similar initiatives in other cities.
Following Activities 1 and 2, CIRCuIT’s project partners also developed a set of data templates and recommendations that can be used to help capture the data needed to integrate circularity, build consistency across the industry and address gaps and weaknesses typically found in the data.
Activity 1: Mapping data in a city
Members of the CIRCuIT project and their built environment stakeholders worked together to map the building material stocks and flows ecosystem in each CIRCuIT city with the aim of building understanding and enabling circularity. To do this, the following data types were investigated:
Inflows of materials or products to the building and infrastructure stock, such as data on installations or material sales
Building and infrastructure stock figures such as number of buildings, total floorspace, kilometres of track, split of building and infrastructure types
Current material stocks in use across existing building and infrastructure
Circular flows of materials or products at end-of-service life to a new-use cycle, i.e. reuse, remanufacture and recycling of building components, products and materials
Outflows/waste flows of materials or products at end-of-service life in buildings and infrastructure stock to landfill, incineration, energy recovery or fly-tipping
Past, current and future demand for buildings and infrastructure, and for the materials and products they contain
Future arisings of materials or products at end-of-use within a city
Externalities – the environmental, social and economic impacts arising from the extraction, operation, transport and disposal of products and materials
Contextual data including data on factors that influence or are related to material stocks and flows, such as demand for new housing
Geographical and land-use data that could provide a basis for mapping and visualisation
Undergoing these activities are key steps in the transition towards a circular built environment, as they can highlight data gaps and other challenges relating to data.
Assessment of mapped data
Variable accessibility of data
Open data is data that can be freely used, modified and shared by anyone for any purpose. This data is usually collated into centralised datasets and shared by local authorities or government bodies. The mapping exercise revealed that a significant amount of open data about a city’s building material stocks and flows is typically available. However, most open data is top-down data, which tends to be broad and lacking granularity.
Public non-open data is data that is usually available to all but has a set of requirements to satisfy prior to access, such as registration fees or a licence. The mapping exercise identified that this is the most common type of data available about a city’s building material stocks and flows.
CIRCuIT partners concluded that making non-open data more freely available would significantly help built environment stakeholders capture a fuller picture of the material stocks and flows in a city, and especially upstream (material supply) and downstream (demolition/waste management) material flows.
Private data is collected by a private entity for their own purpose and is not viewable to the public. The mapping exercise identified that there is a large amount of data held privately about materials stocks and flows. If this was centralised and released as open data (aggregated and anonymised, as appropriate), this data would support and enhance commercial and political decision making relating to the circularity in the built environment.
Data quality issues
Granularity of data – The mapping exercise identified a wide range of granularity across datasets, from single statistics on recycling rates at a national level to real-time data uploaded to centralised planning systems. Overall, the granularity of the surveyed data tended to be low, with many datasets only being updated annually and covering a broad subject area.
Accuracy and reliability of data – The accuracy and reliability of data tends to be difficult to ascertain, largely owing to poor transparency in terms of the data collection methodology, analysis and verification. Often, there is only one dataset relevant to a particular subject available within a city, which means there are often no benchmarks for comparison.
Standardisation of data – There are a large number of datasets from varying sources which use different units and formats. In some cases, even different datasets dealing with the same subject do not use standardised units and formats. Another challenge is the discontinuity of some material and product classifications.
Updating of data – Large variability was observed in terms of how up-to-date datasets are and whether they are actively monitored. In many cases, there was a gap between the data’s timeframe and the date of its publication, which could stretch to a number of years. Additionally, many datasets were identified that were relevant in terms of subject but no longer updated.
Data differences at different points of the construction pipeline
Supply chain – There was little data openly available related to the supply of construction materials. However, there is likely to be substantial data collected privately by supply chain organisations on the volumes of materials being handled and exchanged with upstream or downstream actors in the supply chain. If this data was centralised, aggregated, made openly accessible and, where necessary, anonymised, it could help to plug significant gaps in understandings of material flows. See chapter 6 for more information on our work on material flows.
Building typology – Data on residential building stock was found to be widely available. Building-level datasets were also accessible within the four cities. Both provide a good degree of granularity and a more precise indication of the characteristics of a building, which may be aggregated.
In some cases, however, there was found to be less systematic data collection on non-residential building stock, such as commercial, industrial and retail buildings, despite these being estimated to represent large proportions of stock.
Material stock data refers to materials that are currently in use within buildings and infrastructure. Data that focused on material stock quantities per building or per infrastructure was not available within the CIRCuIT cities. However, there is data available in all cities that could enable a material flow analysis to calculate material stocks.
Waste management and circular material flow data is typically more complete and extensive than other segments of material flow chains. In all the CIRCuIT cities, data was readily available on the tonnage/volume and origin of construction and demolition waste. This data is generally split by material/waste class, partly due to reporting requirements under the European Commission’s Waste Framework Directive. In some cases, data on the destination of waste is also captured.
Activity 2: Assessing the usefulness of available data
After identifying what building material stock and flow data is accessible across each CIRCuIT city, project partners then created 29 potential use cases for how this data could be used to provide insights relevant to the circular economy.
These use cases cover the entire materials stocks and flows ecosystem and include a range of built environment stakeholders, including product manufacturers, contractors, waste management organisations, policymakers, planning authorities and researchers.
To develop these cases, partners first assessed what specific data was needed for each use case, and then looked to determine:
whether the required data existed in each CIRCuIT city and was available to the relevant stakeholders
whether there was any indication of the quality and reliability of data sources that did exist
All 29 use cases can be found in the CIRCuIT report D3.2 Recommendations for improving the capture of material flow data in the built environment. This is available to download at circuit-project.eu/post/latest-circuit-reports-and-publications
Two examples of how data could potentially be used to provide circular economy insights
Use case 1 – Using building typology data to calculate a city’s material stock
If it’s not possible to calculate the amount of materials in individual buildings, it may be possible to follow a building typology-based approach. This involves obtaining or calculating the typical quantities of materials in a range of common building types, which are distinguished from each other according to factors such as age, use class, construction type, and so on.
Using this information, the material totals for the area under study may be calculated based on the number of instances of each building type within it, multiplied by their respective typical material quantities.
Use case 2 – Using historical data to predict demolition rates in a city
One way to estimate the future rate of demolitions in a city is to carry out a survival analysis of building stock.
Historical demolitions data can be used to ascertain patterns related to the typical age that different building types are demolished and the circumstances preceding demolition.
By evaluating information related to a building’s attributes (such as age and use class) and the contextual factors influencing their survival or demolition, it’s possible to identify patterns in mortality and survival of certain building types.
In turn, this may be applied to a city’s current building stock to predict future rates of demolition. See the report Extending the lives of buildings through transformation and refurbishment for more information about identifying buildings at risk of demolition.
Improving data capture across the built environment
In Copenhagen, Hamburg, Vantaa/Helsinki Region and London, CIRCuIT partners identified that data issues are preventing decision makers and built environment stakeholders from increasing circularity in the built environment.
To help address these data gaps and weaknesses, a set of templates were created to improve and standardise the capture of data across the building ecosystem.
Additionally, 17 overarching recommendations were developed for stakeholders across the value chain, from planning officers and policy makers to industry practitioners. These aim to help address gaps and weaknesses in circular data.
Circular economy data templates
Templates help to define the data required at all levels of a city’s built environment ecosystem. These levels relate to the following dimensins: A) components, B) spaces, C) buildings, and D) areas
The templates developed during CIRCuIT are organised as ‘data dictionaries’, where information about an object is listed as ‘properties’. For each property, a description and the recommended unit of measurement are provided, as well as predefined response options, where relevant. Wherever possible, these have been standardised across all levels.
The data templates serve as a complete framework for the consistent capture of data and cohesive sharing of data between professionals. Ultimately, this will improve the collection process of data and help stakeholders to take actions promoting circular use and the management of built environment resources.
Recommendations for addressing gaps or weakness in data
Based on the availability and quality of data found in the mapping exercise outlined in Activity 1, CIRCuIT partners and built environment stakeholders developed a list of recommendations for how data could be improved or applied more effectively to increase circularity in a city’s built environment.
Recommendations on data creation through primary research
Develop a methodology for calculating the reuse potential of a building component or element based on available data
It’s not easy for stakeholders such as building owners or prospective reused material procurers to understand the reuse potential of a building once demolished or disassembled. Research is required to create an approach to fill this gap.
Relevant stakeholder(s) Researchers
Develop a methodology for automatically calculating building and spatial transformation capacity based on available data
Stakeholders cannot easily quantify how transformable a building is. More information is needed to support decision making about whether to attempt to transform a building, replace it, or leave it as it is. Research is required to create an approach to fill this gap.
Relevant stakeholder(s) Researchers
Develop lifecycle assessment (LCA), lifecycle costing (LCC) and social impact factors
Developing these factors at product and building level can incorporate the whole lifecycle impacts related to the transformation, reuse and recycling of materials from existing buildings (urban mining), and design for disassembly and adaptability.
This could be used to model and compare the lifecycle impacts of different approaches or specifications, or to inform decisions on whether to refurbish a building, demolish it or leave it as it is. This could also help to inform retrofit strategies at a city-scale, based on costs and benefits variable by building type and context.
Relevant stakeholder(s) Researchers
Develop methodologies for quantifying the reuse potential/transformation capacity of materials, components, elements and buildings
Once recommendations 1 to 4 have been achieved, and given appropriate data on the building stock, it could be possible to quantify the reuse potentials/residual values of materials, components and elements currently embedded in the building stock, and the transformation capacity of buildings.
Combined with LCA/LCC/social value modelling, this could assist with decision making over how to manage different segments of the building stock to achieve optimal environmental, social and economic outcomes.
Relevant stakeholder(s) Researchers
Recommendations on capture of data by practitioners
Capture data relevant to circular economy according to circularity data templates
As identified by research carried out by CIRCuIT partners, there are issues with the granularity, accuracy and reliability of building materials stocks and flows data, which is preventing cities and built environment stakeholders from increasing circularity in buildings and infrastructure.
Getting cities and stakeholders to capture the data outlined in the data templates developed by CIRCuIT partners could help overcome this issue. See above for more information about the templates.
Relevant stakeholder(s) Construction industry
Recommendations on data standardisation and interoperability
Develop and mainstream the use of circularity indicators
Strong circularity indicators will enable cities and stakeholders to consistently measure circular economy approaches. This will help with the setting of targets and improve the sharing of information between stakeholders.
Please see above to read the set of key circularity indicators developed and recommended by CIRCuIT partners for cities. You can also see how CIRCuIT cities used circularity indicators in practice by visiting the Circularity Dashboard at circuit-project.eu/circularity-dashboard
Relevant stakeholder(s) Researchers Policy makers Construction industry
Develop and mainstream the use of circularity data templates at multiple levels
Data templates that identify what data is necessary to support circular action in the built environment should be developed. Standardisation is absolutely essential, as is the ability to integrate the data captured by the templates.
This supports the better exchange of data between stakeholders at different levels of organisations and at different points in material lifecycles.
Relevant stakeholder(s) Researchers Policy makers Construction industry
Develop and mainstream data exchange methodologies for integration of material and product data with building data
Currently, there is little ability to carry through material/product data to building information models (BIM) upon installation, and from BIM models to subsequent data management systems upon the material or product’s deinstallation from the building.
Without this ‘golden thread’ of data from cradle-to-cradle or cradle-to-grave of a material, it is less easy for subsequent material/product handlers to understand the origin and circular economy-related attributes, and to make decisions that promote circularity.
Relevant stakeholder(s) Standards organisations Researchers
Recommendations on exchange of data between stakeholder groups
Capture data on each unit of material, component or element throughout its lifecycle, and store it in a transferable digital record
This would enable accurate and transparent measurement and modelling of circularity and lifecycle impacts at any point across the value chain. As a result, a procurement manager, for example, could calculate exactly how the use of a particular product may impact the footprint of their project. Relevant data may include material passport data, as well as composition, circularity indicators, and any other circular economy-related information.
Relevant stakeholder(s) Construction industry
Create, update and handover building information models (BIM) to relevant stakeholders, depending on building lifecycle stage
BIM models will be essential in circular economy since they allow the storage and sharing of data useful for circular decision making between relevant stakeholders. Additionally, given appropriate data on the impacts of a product, design or logistical method, they may be used to model the whole life impacts different project approaches through integration of LCC/LCA and social impact assessment approaches.
Relevant stakeholder(s) Construction industry
Recommendations on integration of data into databases
Create a database of services and facilities assisting with circular economy of the built environment
This could follow the example of the London Waste Map and its underlying database, expanded to include all services and facilities of use to the circular economy, with live or regularly updated data that is readily integrated into the management systems of stakeholder groups.
Relevant stakeholder(s) Policy makers
Create a live database of material stocks and flows
A city level database that records where materials are stocked and how they flow throughout the city system, including data of relevance to circular economy such as whether materials are reused or what their typical sale prices are.
If aggregated and analysed, this would be a valuable resource for planning and policymaking to enable city-level material flow management (including waste management), as well as for other applications, for example, prospective material sellers being able to understand the likely market value of their assets post-demolition.
Relevant stakeholder(s) Construction industry Policy makers
Create a live building stock database
This database could include data on existing building stock, as well as predictive or modelling capabilities regarding the future of building stock. This could inform decision making and strategy by planning officers and policymakers as to how to modify patterns of construction, refurbishment and demolition to achieve the best social, economic and environmental outcomes.
Relevant stakeholder(s) Construction industry
Recommendations on analysis of databases
Quantify and predict rates of circular economy-related building stock dynamics
Understanding the existing rates of building stock dynamics (e.g. new construction on greenfield sites, demolition and replacement, transformation, design for disassembly and adaptability in new construction, the reuse and recycling of materials, etc), as well as more detailed information such as the typical efficiencies, financials and impacts associated with different approaches, is useful for developing strategies, benchmarks and policies that decision makers in cities’ construction and buildings sectors can use to guide their actions.
Relevant stakeholder(s) Researchers
Quantify and predict stocks and flows of (reusable / recyclable) materials, components and elements from building stock
Understanding the profile and quantities of different building materials, components and elements within building stock, and those that are projected to emerge from the stock, can inform strategies and policies around recycling, reuse and building stock management.
Relevant stakeholder(s) Researchers
Quantify and predict demand for reused and recycled products
Understanding the demand for reused and recycled products can allow prioritisation of which building stock segments may be demolished and those for which demolition should be avoided, based on both the proportions of recyclable and reusable parts within them, as well as the level of demand for those parts.
Relevant stakeholder(s) Researchers
Indicators for measuring circularity
For the CIRCuIT project, a ‘circularity indicator’ is a piece of information that any stakeholder in the built environment sector can use to measure performance and guide their decision making to enable a circular economy.
Numerous circular indicators have already been developed around the world. However, these indicators vary significantly, with most using different methodologies, structures, terminologies and measures.
This lack of standardisation is currently a significant barrier to built environment stakeholders who wish to accelerate circularity in their city and beyond. To address this issue, CIRCuIT partners used the findings from their city data mapping exercises and a comprehensive research programme to identify a list of key circularity indicators for cities.
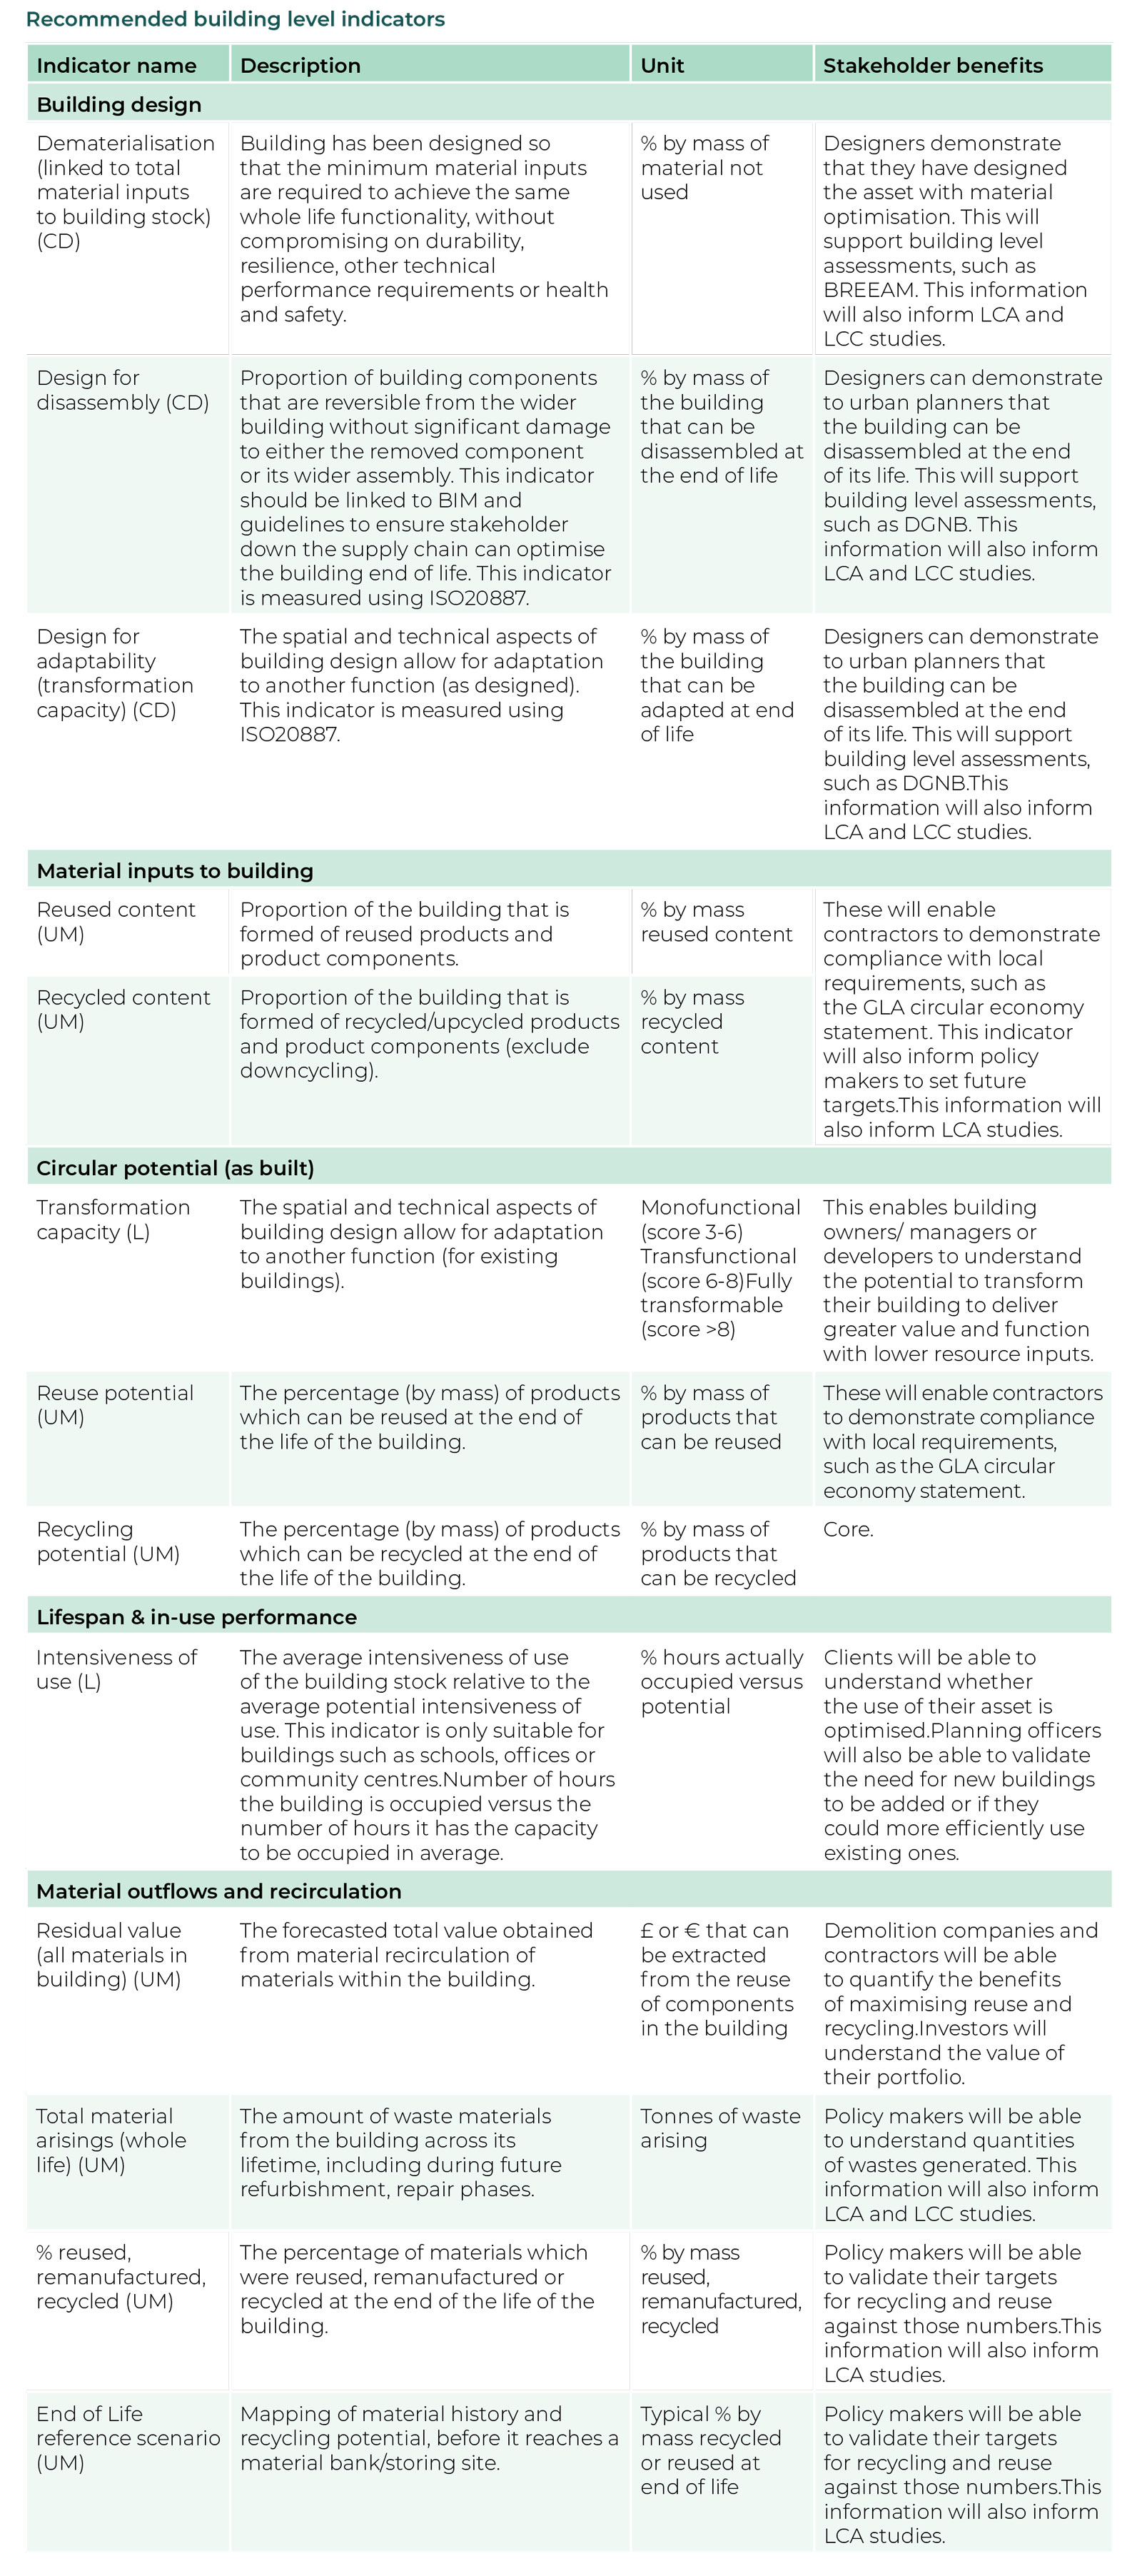
The indicators provide an overview of circularity at city, building and materials levels and use a mix of impact metrics (such as recycled content, material use), productivity metrics (e.g. per value, area) and enabler metrics (the number of projects with circularity economy requirements).
Each of the 37 indicators is listed with supporting information, including which built environment stakeholder it is relevant to.
Built environment stakeholders can look through the indicators to understand what they should measure to support circularity in their city. The indicators can also be used to measure the environmental, economic and social impact of circular economy decisions and set circular targets for stakeholders, from product designers to local authorities.
At a city-level, the indicators can help to support evidence-based policy and planning development, as well as decision making to support the circularity of material flows within buildings and throughout material lifecycles.
How local government can use policies to drive circularity in their city is explored further in the report titled Using policy to power circular construction.
Using indicators in the real world
CIRCuIT partners identified five key circularity indicators for their cities. These are presented visually on a Circularity Dashboard at circuit-project.eu/circularity-dashboard
Read more about the Circularity Dashboard and other online tools developed as part of the CIRCuIT project in Chapter 6.

 Further reading
More information on the tools, methodologies and recommendations developed by CIRCuIT to standardise and improve the capture of circular data for the built environment is available in the reports listed below.
D3.1 State of the art on material flow data in the built environment
D3.2 Recommendations for improving the capture of material flow data in the built environment
D3.3 Recommendations on circularity indicators for WP8
D3.4 Report on the creation of CIRCuIT circular economy data templates
D3.5 Business case for database and marketing strategy
D3.6 Finalised framework of data attributes and analytics for pilots
D3.7 How to exploit the framework and data at city level
All these reports can be downloaded at circuit-project.eu/post/latest-circuit-reports-and-publications
Acknowledgements
A4.1 Chapter Acknowledgements
The following individuals authored the deliverables that form the basis of this chapter.
Ann Bertholdt, City of Copenhagen
Andrea Charlson, ReLondon
Antony Maubach-Howard, Hamburg University of Technology
Ben Cartwright, The Building Research Establishment
Caroline Weeks, The Building Research Establishment
Daniël Antony van Peer, The City of Copenhagen
Eleanor Turner, The Building Research Establishment
Emil Møller Rasmussen, The City of Copenhagen
Flavie Lowres, The Building Research Establishment
Gilli Hobbs, The Building Research Establishment
Henna Teerihalme, Helsinki Region Environmental Services Authority
Janus zum Brock, Hamburg University of Technology
Kaie Small-Warner, The Building Research Establishment
Kimmo Nekkula, The City of Vantaa
Mahsa Doostdar, Hamburg University of Technology
Marco Abis, Hamburg University of Technology
Martin Tilsted, The City of Copenhagen
Mathias Peitersen, The City of Copenhagen
Mette Skovgaard, The City of Copenhagen
Petra Pikkarainen, Helsinki Region Environmental Services Authority
Rachel Singer, ReLondon
Rune Andersen, Technical University of Denmark
Shashvati Hadkar, The Building Research Establishment
Shribavani Shrikaran, The Building Research Establishment
Tapio Kaasalainen, Tampere University
Tessa Devreese, ReLondon
Thor Nyborg Bendsen, The City of Copenhagen
Tiina Haaspuro, Helsinki Region Environmental Services Authority
Tom Jennings, The Building Research Establishment
Uta Mense, The City of Hamburg
Vasiliki Savvilotidou, Hamburg University of Technology